How to use the bébé bloom ovulation test and track your cycle

Tracking your menstrual cycle is an essential part of understanding your fertility. With bébé bloom’s at-home ovulation strip tests, you can monitor your cycle with ease and accuracy, empowering you to take charge of your fertility journey. Here’s a simple guide to get started:
Part 1. Understanding your cycle
Your menstrual cycle has different phases, and ovulation—the release of an egg from your ovary—is the key event when trying to conceive. Ovulation typically occurs around the midpoint of your cycle, but tracking helps pinpoint the exact timing for your body.
Cycle tracking tips:
Work out the length of your menstrual cycle. Record the start date of your period each month to calculate the average length of your cycle. This gives you a baseline to work from when using ovulation tests.
Use the When To Start Chart below to know when to start testing ovulation. Count the number of days between the first day of this period and the first day of your next period. If the length of your cycle is different each month, simply take the average number of days in the last 3 cycles.
Table 1. When To Start Chart
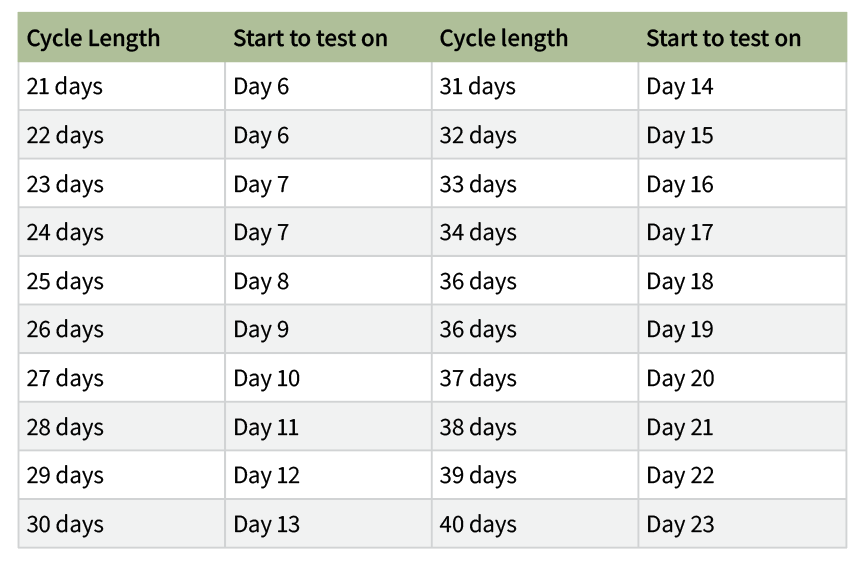
Example: If your cycle length is 28 days, you can begin testing 11 days after the first day of your period.
Note: If your cycle length is outside of the range shown in the table: Cycle is 21 days or less, start testing on day 5. Cycle is longer than 40 days, start testing 17 days before you expect your next period.
Part 2. Using bébé bloom’s ovulation tests to pinpoint your two most fertile days
Luteinising hormone (LH) is a hormone that periodically changes with your menstrual cycle. The bébé bloom® Ovulation Test uses your urine to detect the increase (surge) in the LH hormone. The LH surge occurs approximately 24-36 hours before the release of ovarian eggs via the ovulation process.
As fertility is highest on the day your LH surge is detected and the day after, the bébé bloom® Ovulation Test tells you your two most fertile days in any given cycle. Sexual intercourse during this 48-hour window will maximise your chances of becoming pregnant.
Top tips before you begin testing:
Use the When To Start Chart provided in the kit to determine which day of your cycle to begin testing.
For best results, test at a similar time each day. Keep in mind, your first urination of the day is not recommended. We suggest any time between 10am and 10pm as LH levels tend to peak later in the day.
Dip the test strip in urine as instructed. A positive result means your LH is surging, and ovulation is likely to occur within the next day or two.
Don’t mix urine specimens from different times.
Continue testing for at least six days (from the starting date), or until the LH surge has been detected. Once started, the test can be performed once per day.
Use additional tests during your fertile window for greater accuracy. For example, perform the test once every 4 hours, or at least twice a day (once mid-morning and once in the evening).
How to take the test:
Follow these steps to get the most accurate results.
Step 1. Urinate into a clean and dry plastic or glass container.
Removing the test strip from the sealed pouch, insert the strip into your urine as soon as possible. Note: Do not touch the membrane located within the “Result Windows” and “Sample absorbent pad”. Do not open the foil pouch until the urine is collected and ready to be tested.
Step 2. Submerge the test strip vertically for at least 10-15 seconds.
With the arrows pointing toward the urine, submerge the test strip vertically for at least 10-15 seconds. Be careful not to dip the strip past the MAX line as shown below in Image 1. Note: Once you see a red liquid appear in the result observed area, you may remove the test strip from the urine specimen and place the test strip down on a clean, dry, non-absorbent, flat surface.
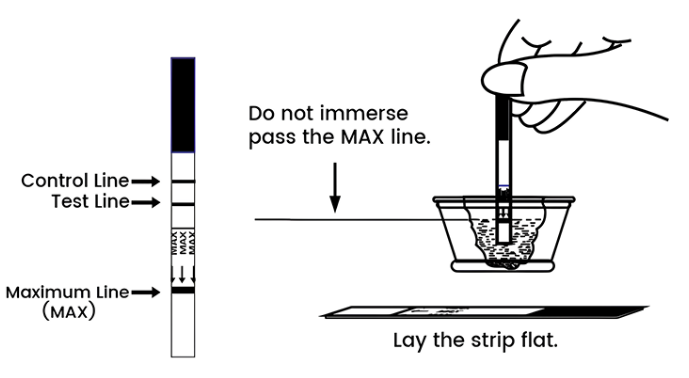
Image 1. Correct level to dip the test strip
Step 3. Read your results.
Allow 5 to 10 minutes after completion of step two and then read your test results. Once 10 minutes have passed, the result is no longer considered an accurate reading.
Note: The bébé bloom® Ovulation Test helps to predict ovulation by using in vitro semiquantitative detection of luteinising hormone (LH) in your urine, This means that whilst traditional ovulation tests only provide a positive or negative result, bébé bloom® Ovulation Test provides a numerical LH range from 0-80mIU/ML (Image 2-Side 1-Test Values).
Step 4. Match the Test Line (T) colour on the ovulation test strip to the Test Reader Colour Chart (Image 2).
If the T line colour falls between two markers (e.g., 5 and 10), either:
Take the midpoint of the two numbers, or
Select the closest colour and corresponding number value after 5–10 minutes of testing.
Note: If the test line darkens over time, it’s recommended to test at least twice daily.
There are three possible results:
1. Red lines appear in both the Control Line (C) area and the Test Line (T) area.
Use the Test Reader Colour Card (side 1) to compare the colour of the Test Line (T) and find the closest colour on the card of LH semiquantitative detection. Record the test result using the corresponding number value of the colour on the LH Fluctuation Curve Chart (side 2)and include the date and time you took your test. Note: If your test results colour falls between two adjacent colours on the card, take the middle value of the two numbers. Alternatively, choose the colour it is closest to and use this number.
2. The red line appears only in the Control Line (C) area but not in the test line (T) area.
This means the concentration of LH in the test sample is 0. Record this test result accordingly.
3. No red line appears in the control line (C) area.
This means the test result is invalid. We recommend reading the instructions carefully and attempting the test again. If you’re still having issues, contact us hello@bebebloom.com.au
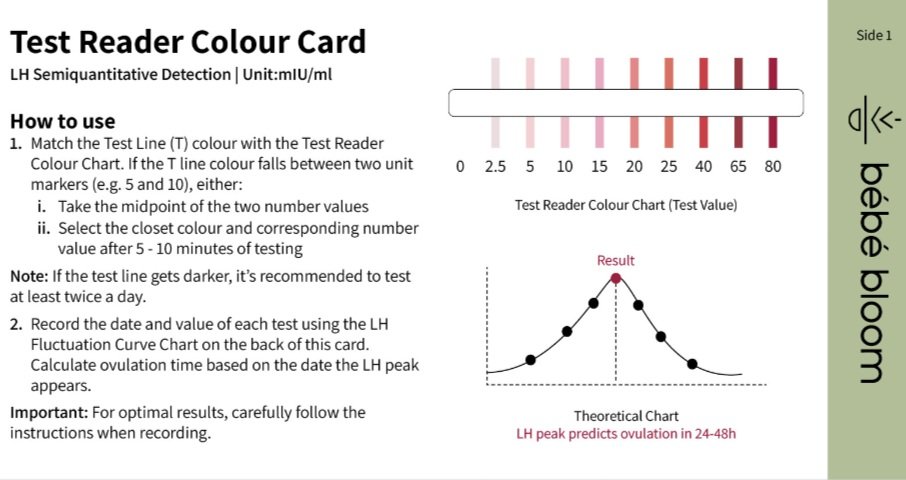
Image 2. Test Reader Colour Card (Side 1.)

Image 3. LH Fluctuation Curve Chart (Side 2.)
Step 3. Record your result and draw your LH Fluctuation Curve.
Record the date and value of each test using the LH Fluctuation Curve Chart (Image 3-Side 2). Use this data to calculate the ovulation time based on the LH peak. Important: For optimal results, carefully follow the instructions when recording values.
Find the corresponding positions on the detection chart. The horizontal axis represents the number of tests and detections. The vertical axis represents the value of LH detected (results). Record your results on the axis every day. Then connect the dots to achieve your own LH curve. From this curve you should be able to clearly see your LH peak.
Part 3: Combine tools for optimal tracking
For your best chance at a healthy cycle, combine ovulation tracking with other methods, like:
Monitoring Basal Body Temperature (BBT): A consistent rise in temperature confirms ovulation.
Checking cervical mucus: Fertile mucus is clear, stretchy, and egg-white-like.
Test for pregnancy as early as 6 days before your expected period using bébé bloom’s early detection pregnancy tests
Support your fertility with simple changes such as maintain a balanced diet rich in whole foods, reduce stress through mindfulness or light exercise, avoid smoking and limit alcohol and caffeine.
These strategies can empower you to take control of your fertility journey and support your mental wellness.
Remember, every journey is unique, and it’s okay to seek support along the way. Whether you’re just starting out or have been trying for some time, bébé bloom is here to nurture and affirm your fertility journey.
Let us know your ovulation tracking tips or share your story in the comments below!
Purchase our ovulation tests in our shop.
Refer to the Instructions for use pamphlet for Frequently Asked Questions or locate them on our site.
For advice, visit trusted Australian resources such as Your Fertility or Fertility Society of Australia.
Disclaimer: This blog is for informational purposes only and does not constitute medical advice. Always consult a qualified healthcare professional for personalised advice regarding your fertility journey.